Outage Dashboards: Important Utility ETR Reports
Utility customers have higher expectations than ever. They depend on reliable utility service, and when they experience an outage, they expect timely, accurate information on service restoration.
These heightened customer expectations are increasingly reflected in regulatory requirements. Utilities are under mounting pressure to not only resolve outages as quickly as possible but provide highly accurate restoration information along the way.
Utilities use ETR metrics to track restoration projections and provide customers with the most accurate possible information.
In this blog, we look at some key ETR-related data elements and why they matter for utilities. Placing this data at the fingertips of utility decision makers helps improve customer communication, optimally manage outages during storm events, and analyze outage resolution predictions in pursuit of continuous improvement.
What is ETR and why is it so important?
ETR is the metric used by utilities to track service restoration. This acronym refers to “Estimated Time to Restoration.” Projected ETR time can depend on factors like crew availability, the number of other customers experiencing an outage, and the duration of a storm. This projection is usually generated automatically based on reported outages but can also be modified as needed by crews in the field as they learn more about the root cause of the outage.

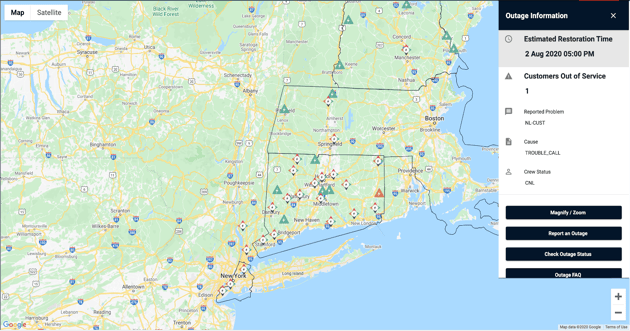
Outage Map
When customers experience an outage, they want to know how long their service will be out and when it will be restored. Customers depend on ETR projections and set expectations accordingly. Consequently, utilities need to be as transparent and accurate as possible when providing ETR information to customers.
Even restoring service too early relative to ETR can result in an unhappy customer. For example, if a customer sees that power will be restored in 8-10 hours, they may begin preparations like emptying their freezer. If power subsequently returns in just 2 hours, they may blame the utility for forcing them to do this work for no reason! This scenario illustrates why generating accurate ETR data can be just as important to the customer as restoring power quickly. An accurate, stable ETR is far more valuable to the customer than an ETR that is constantly being revised.
The ETR insight desired by customers is deceptively simple. Behind the scenes, determining and achieving projected restoration times requires utilities to track a variety of data. This data needs to incorporate multiple sources, such as system-generated estimates and updates from crews working to restore service.
Tracking and Managing ETR Performance: Important Data Elements
Tracking and managing ETR data is important for both:
- Real-Time Outage Management: managing restoration workflows in real-time as the organization works to restore service during a storm.
- Post-Event Analysis and Operations Optimization: utilities seeking continuous improvement for both restoration time and ETR-accuracy need detailed, nuanced metrics on how ETR metrics were generated, how they changed over the course of a storm, and how often ETR projections were achieved.
Examples of Valuable Data Elements for an ETR Report
- Initial ETR: The system generated ETR calculated during an outage event.
- Customer-Reported ETR: ETR information provided to the customer.
- Number of ETR Changes: how many times the customer estimate was revised—the fewer, the better.
- Crew ETR Change Details: which ETR changes were crew- versus system-initiated? This metric is useful for post-storm analysis and determining the sources behind ETR revisions.
- Timeliness of Customer ETR Information: how far in advance of restoration was ETR data updated? For instance, a customer receives limited value from being informed at 2:55 that service will be restored at 3:10.
- Performance Metrics Related to ETR Goals: Comparative metrics that are configurable to reflect a utility’s goals for continuous improvement. These metrics are used in post-storm analysis to track results v. targets for various components of ETR data.
- Real-Time Dispatch Center Alerts: customizable alerts can help coordinate a response that reflects the ETR information provided to customers. Information that may be crucial to dispatchers includes events with no ETR, ETR’s expiring in the next 45 minutes, and active outages with ETR’s that have already expired.
Detailed ETR Reports for Your Outage Dashboard
As the data elements above illustrate, detailed, nuanced ETR metrics are essential for not only quality customer service but managing operations.
In this context, utility decision makers need the right ETR metrics at their fingertips whether they are coordinating the response to a storm or implementing a strategy to improve organizational ETR times. Ideally, utility professionals should have access to ETR reports that can be configured to reflect organization-specific goals and processes. They should not need to query a database or comb through a spreadsheet simply to check ETR metrics.
To drive the maximum value from this data, all the elements listed above should be available in a convenient, context-rich format.
HEXstream’s Utility360 solution provides crucial ETR data through user-friendly dashboards. In fact, this comprehensive outage analytics solution offers fully customizable dashboards that streamline access to analytics for every aspect of outage management, from real-time storm response to regulatory reporting. Utility360 integrates seamlessly with leading OMS systems and can support any of your favorite visualization tools.
Let's get your data streamlined today!
Other Blogs
Unleashing the Benefits of Real-Time Maximo-OFS Integration in Utilities
Maximo and Oracle Field Service (OFS) Integration for Real-Time Data: How the Utilities May Benefit.
In the race to digital transformation, where should utilities start?
Almost every business leader in the utility space and beyond has heard the buzz about “digital transformation.” And for good reason! The right digital
Why Utilities Need to Embrace Modern Technologies to Improve Cloud Adoption
Utilities have begun adopting cloud-based capabilities across a cluster of key business functions such as customer experience, asset management, and r
